How to Use Statistical Tests in UX Research
Moderated by Michele L. Oliver, Ph.D., UXr Guild Board President
This is an abridgment; view the full video presentation here.
Session 2 – October 13, 2022
This session in The Q&As of Quantitative UX Research Methods series is an extension of the first session. In this session, Michele discussed different statistical tests and how and when to use them.
What are the Different Types of Data?
Identify data to identify which test to use:
- Nominal – For this kind of data, think name. You can use any type of labeling (words or numbers) but the categories assigned don’t mean anything. For example, 1 = Mac, 2 = PC, 3 = Mobile. It’s more helpful to think of a name. You can use any kind of label. Categories are different, but there is no difference between the name and the label.
- Ordinal – For this data, think rank or order. These have a specific order and are typically labeled with an order or rank. However, there is no difference between the categories. Rank or order is going to be important. Example – the months of the year: there’s an order. But the differences between the months don’t matter. In research, we speak of the five-point Likert scale, where one is very difficult and five is very easy. Those ranks mean something.
- Interval – This categorizes precise and continuous intervals, but it has no true zero. As an example, think of temperature. If we went to zero, it doesn’t mean there is an absence of temperature – zero degrees mean something.
- Ratio – This is the same as Interval data, but it has a true zero. Because the two are so similar, except that true zero, that data is analyzed the same way, so it is usually called interval/ratio data.
What Kind of Test Should I Run Based on the Type of Data?
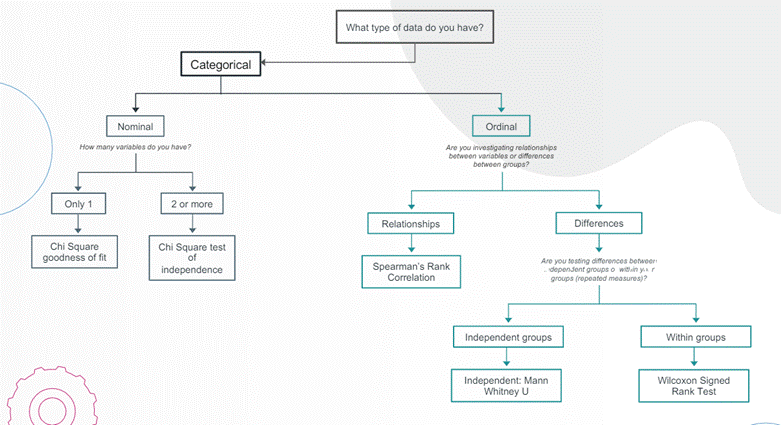
When you can identify what kind of data you have, it will help narrow down the types of tests which would be used in any given scenario. First, let’s break down Categorical Data, then we’ll look at Numerical Data.
A. Categorical:

- Nominal – How many variables do you have?
a. Only one variable – Chi-Square test – tests one variable with a distribution. Test against the norm.
b. Two or more variables – Chi-Square test of independence. Testing them against each other. - Ordinal Data: Are you investigating relationships between variables or differences between groups?
a. Relationships – Use Spearman’s Rank Correlation
b. Differences – Are you testing differences between independent groups or within your groups (repeated measures)?
i. Independent groups – Use Mann Whitney U
ii. Within groups – Use Wilcoxon Signed Rank Test
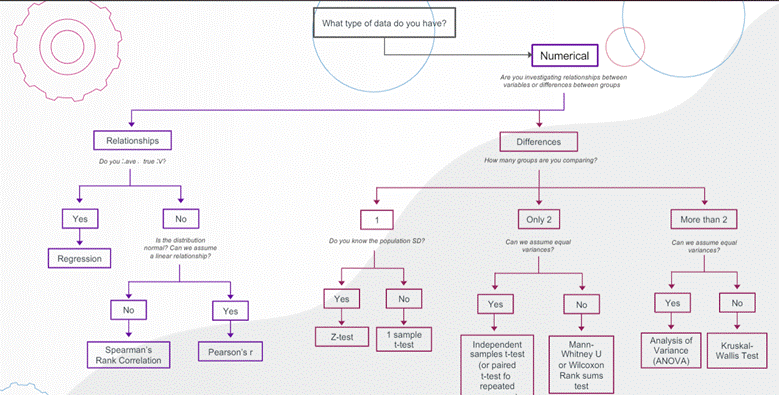
B. Numerical – Are you investigating relationships between variables or differences between groups?

- Relationship – Do you have a true Independent variable (IV)?
a. Yes – Regression.
b. No – Is the distribution normal – can we assume a linear relationship?
i. No – Spearman’s Rank Correlation
ii. Yes – Pearson’s r - Differences – How many groups are we comparing?
a. One group – Do I know the population Standard Deviation?
i. Yes – Z-test
ii. No – 1 sample t-test
b. Only two groups – Can we assume equal variances?
i. Yes – Independent samples t-test (or paired t-test for repeated measures)
ii. No – Mann-Whitney U or Wilcoxon Rank sum test
c. More than two groups – Can we assume equal variances?
i. Yes – Analysis of Variance (ANOVA)
ii. No – Kruskal-Wallis Test
Statistics in Action
You must have a clear understanding of what you and your teams want to know and understand what your variables are so that you can identify the most appropriate test for your study.
Usability Testing: Create a New Communication Plan
Steps for Running an Independent T-test Using Excel
- Select “Data” from Menu
- Select “Data Analysis”
- Select t-Test: Two Square … Equal Variances
- Select the range for the first variable
- Repeat the second variable
- Ensure that “Labels” is checked
- Set “Alpha” to 0.05
- Set a range for the output to appear
- Write up your findings!
Some tips on using Usability Tests:
- As far as the sample size for a quant usability test, try to get about 30. The idea is that as you approach 30, your distribution starts to look more normal. That’s the rationale since your goal is to get as close to our normal distribution.
- Don’t be afraid to collect more than what’s asked. You have participants right there, so get as much information as possible.
- The 0.05 is standard – you will want to allow yourself a 5% error
- If you wonder when time on task is most appropriate in a usability test, it depends on what your team wants to know.
- Use a one-tail test if you are predicting the difference to be in one direction. But if you have two prototypes and you’re considering going in two different directions, then you should go with a two-tail test.
Surveys: (JTBD) Jobs to be done
An example of when surveys would be used is when you have no existing data anywhere. You may have assumptions but no data. Conduct several interviews to identify needs and then create needs statements from that data, to be put into a survey to validate those needs. This is where the value of JTBD or Jobs To Be Done, as described by Tony Ulwick, comes into play.
Steps for Conducting a JTBD Framework
- Conduct interviews to identify needs.
- Validate needs via a survey (importance satisfaction.)
- Create frequency counts for each of the responses. How many people reported Not at all, Somewhat for both important and satisfaction metrics.
- Create importance and Satisfaction proportions.
- Divide the proportion by 10.
- Calculate Satisfaction Gap Score = Importance Score – Satisfaction Score
- Calculate the Opportunity Score = Importance Score + Satisfaction Gap
- Rank order the opportunity scores.
What About Correlations?
The good thing about correlations is that you can throw them all into the analysis. Be mindful that the output will only look at pairs at a time. Because of this, you don’t have to do separate correlations for each pair that you’re interested in.
Steps for Conducting a Correlation
- Select “Data” and then “Data Analysis.”
- Select “Correlation.”
- Select the Input Range from your spreadsheet.
- Select the output range.
- Select Ok.
- Write up your results!
In the third and final session in The Q&As of Quantitative Methods series, Michele will explore more detailed statistics including A/B Testing, Chi-Square, and effect sizes. These more advanced calculations may seem daunting, but Michele will explain how all these, and many more calculations, can be done using an Excel spreadsheet.
Michele Oliver has a Ph.D. in Experimental Psychology with an emphasis on Psychophysiology, Statistics, and Research Methods. She has been a Senior Lecturer and Adjunct faculty member. She is currently a Principal UX Researcher at Ellucian, a provider of SAAS solutions for higher education. Contact Michele at michele@uxrguildorg.flywheelstaging.com or through the UXr Guild Slack Channel.
Past Events
• Book Groups
– Accessibility for Everyone
• Do You Want to Be a UXR Consultant?
• Research Rumble
Session 1 – Research Democratization
Session 2 – Are Personas an Effective Tool?
Session 3 – How Important are Quant Skills to UX Research?
Session 4 – AI in UX Research
Session 5 – Do UX Researchers Need In-depth Domain Knowledge?
Session 6 – Evangelizing Research: Whose Job Is It?
• How to Freelance
– Are You Ready to Freelance?
– Do You Need a Freelance Plan?
– How Do You Find Freelance Clients?
– Which Business Entity is Best for Freelancers?
– How to Manage a Freelance Business
– How to Start and Manage Your Freelance Business
– What is a Freelance UXR/UX Strategist?
– Can Your Employer Stop You From Freelancing?
• Leveling Up with UX Strategy
Session 1 – What is UX Strategy?
Session 2 – UX Strategy for Researchers
Session 3 – Working with Your UX Champions
• Quantitative UX Research Methods
Session 1 – When to Use Which Quantitative Methods
Session 2 – How to Use Statistical Tests in UX Research
Session 3 – Using Advanced Statistics in UX Research
• Transitioning to Freelance UX Research
Session 1 – Transitioning to Freelance
• Farewell Academia; Hello UXr
Session 1 – How to Create a UXr Portfolio
Session 2 – Creating UX Research Plans, Moderation Guides, and Screeners
Session 3 – Recruiting and Fielding UX Research Study Participants
Session 4 – Creating UX Analysis Guides and Portfolios
Session 5 – Portfolio Case Studies and LinkedIn Profiles, and Partnering with Recruiters
Session 6 – Framing Impact in UXr Portfolios and Resumes
• UX Research in the Automotive Industry
• How to Make Your Life as a Freelancer the Best it Can Be
– UX Research Freelance Work-Life Balance
• UXr Guild is Meeting UX Researchers in New York City
– How to Become a Freelance UX Researcher
Past Events
• How to Make Your Life as a Freelancer the Best it Can Be, August 12, 2021, via Zoom
– UX Research Freelance Work-Life Balance
• UXr Guild is Meeting UX Researchers in New York City, July 8, 2021, New York City
– How to Become a Freelance UX Researcher

